Claude Platform 推出 Agent 可观测性:支持 OpenTelemetry 追踪
英文标题:ArticleOct 14, 2026Agent observability on the Claude PlatformAnnouncing OpenTelemetry traces from Claude Managed Agents, the Messages API, and Claude SDKs on the Claude Platform.
Claude Platform 现支持将 Claude Managed Agents、Messages API 和 Claude SDKs 的 OpenTelemetry(OTel)追踪数据发送至任意兼容工具。开发者可在同一可观测性平台中查看 Agent 的模型调用、工具使用和 MCP 服务器调用,并获得延迟、Token 用量与请求 ID 等信息。该功能遵循 OpenTelemetry GenAI 语义约定,可与 Grafana Cloud、Datadog、Langfuse、Sentry 等工具集成,用于排障、评估 Agent 质量及追踪组织级用量。目前该能力处于公开测试阶段;Managed Agents 和 Messages API 需在 Claude Console 配置目标端,Claude SDKs 则会自动导出追踪数据。
 341.4 KB
 15.2 KB
 3.9 KB
 2.5 KB
 2.4 KB
 16.7 KB
 8.5 KB
 6.9 KB
 53.1 KB
中文
现在,你可以将 Claude Managed Agents、Messages API 和 Claude SDKs 的 OpenTelemetry(OTel)追踪数据发送到任何 OTel 工具,并跟踪 Agent 执行的每一个步骤。如果你已将 Claude Code 或 Cowork 的追踪数据发送至可观测性工具,那么你在 Claude Platform 上构建的 Agent 现在也可以出现在同一个位置。
使用 OpenTelemetry 追踪 Agent
要将更多访问权限托付给 Agent,首先应追踪其模型调用、工具使用和 MCP 服务器调用。审查其追踪数据,然后在它证明可靠后逐步扩大其访问权限。
在 Claude Console 中添加一个目标端后,每个 Agent 轮次、模型调用和工具使用都会以标准 OpenTelemetry 追踪的形式发送至你的可观测性工具,其中包含延迟、Token 和 ID 信息。
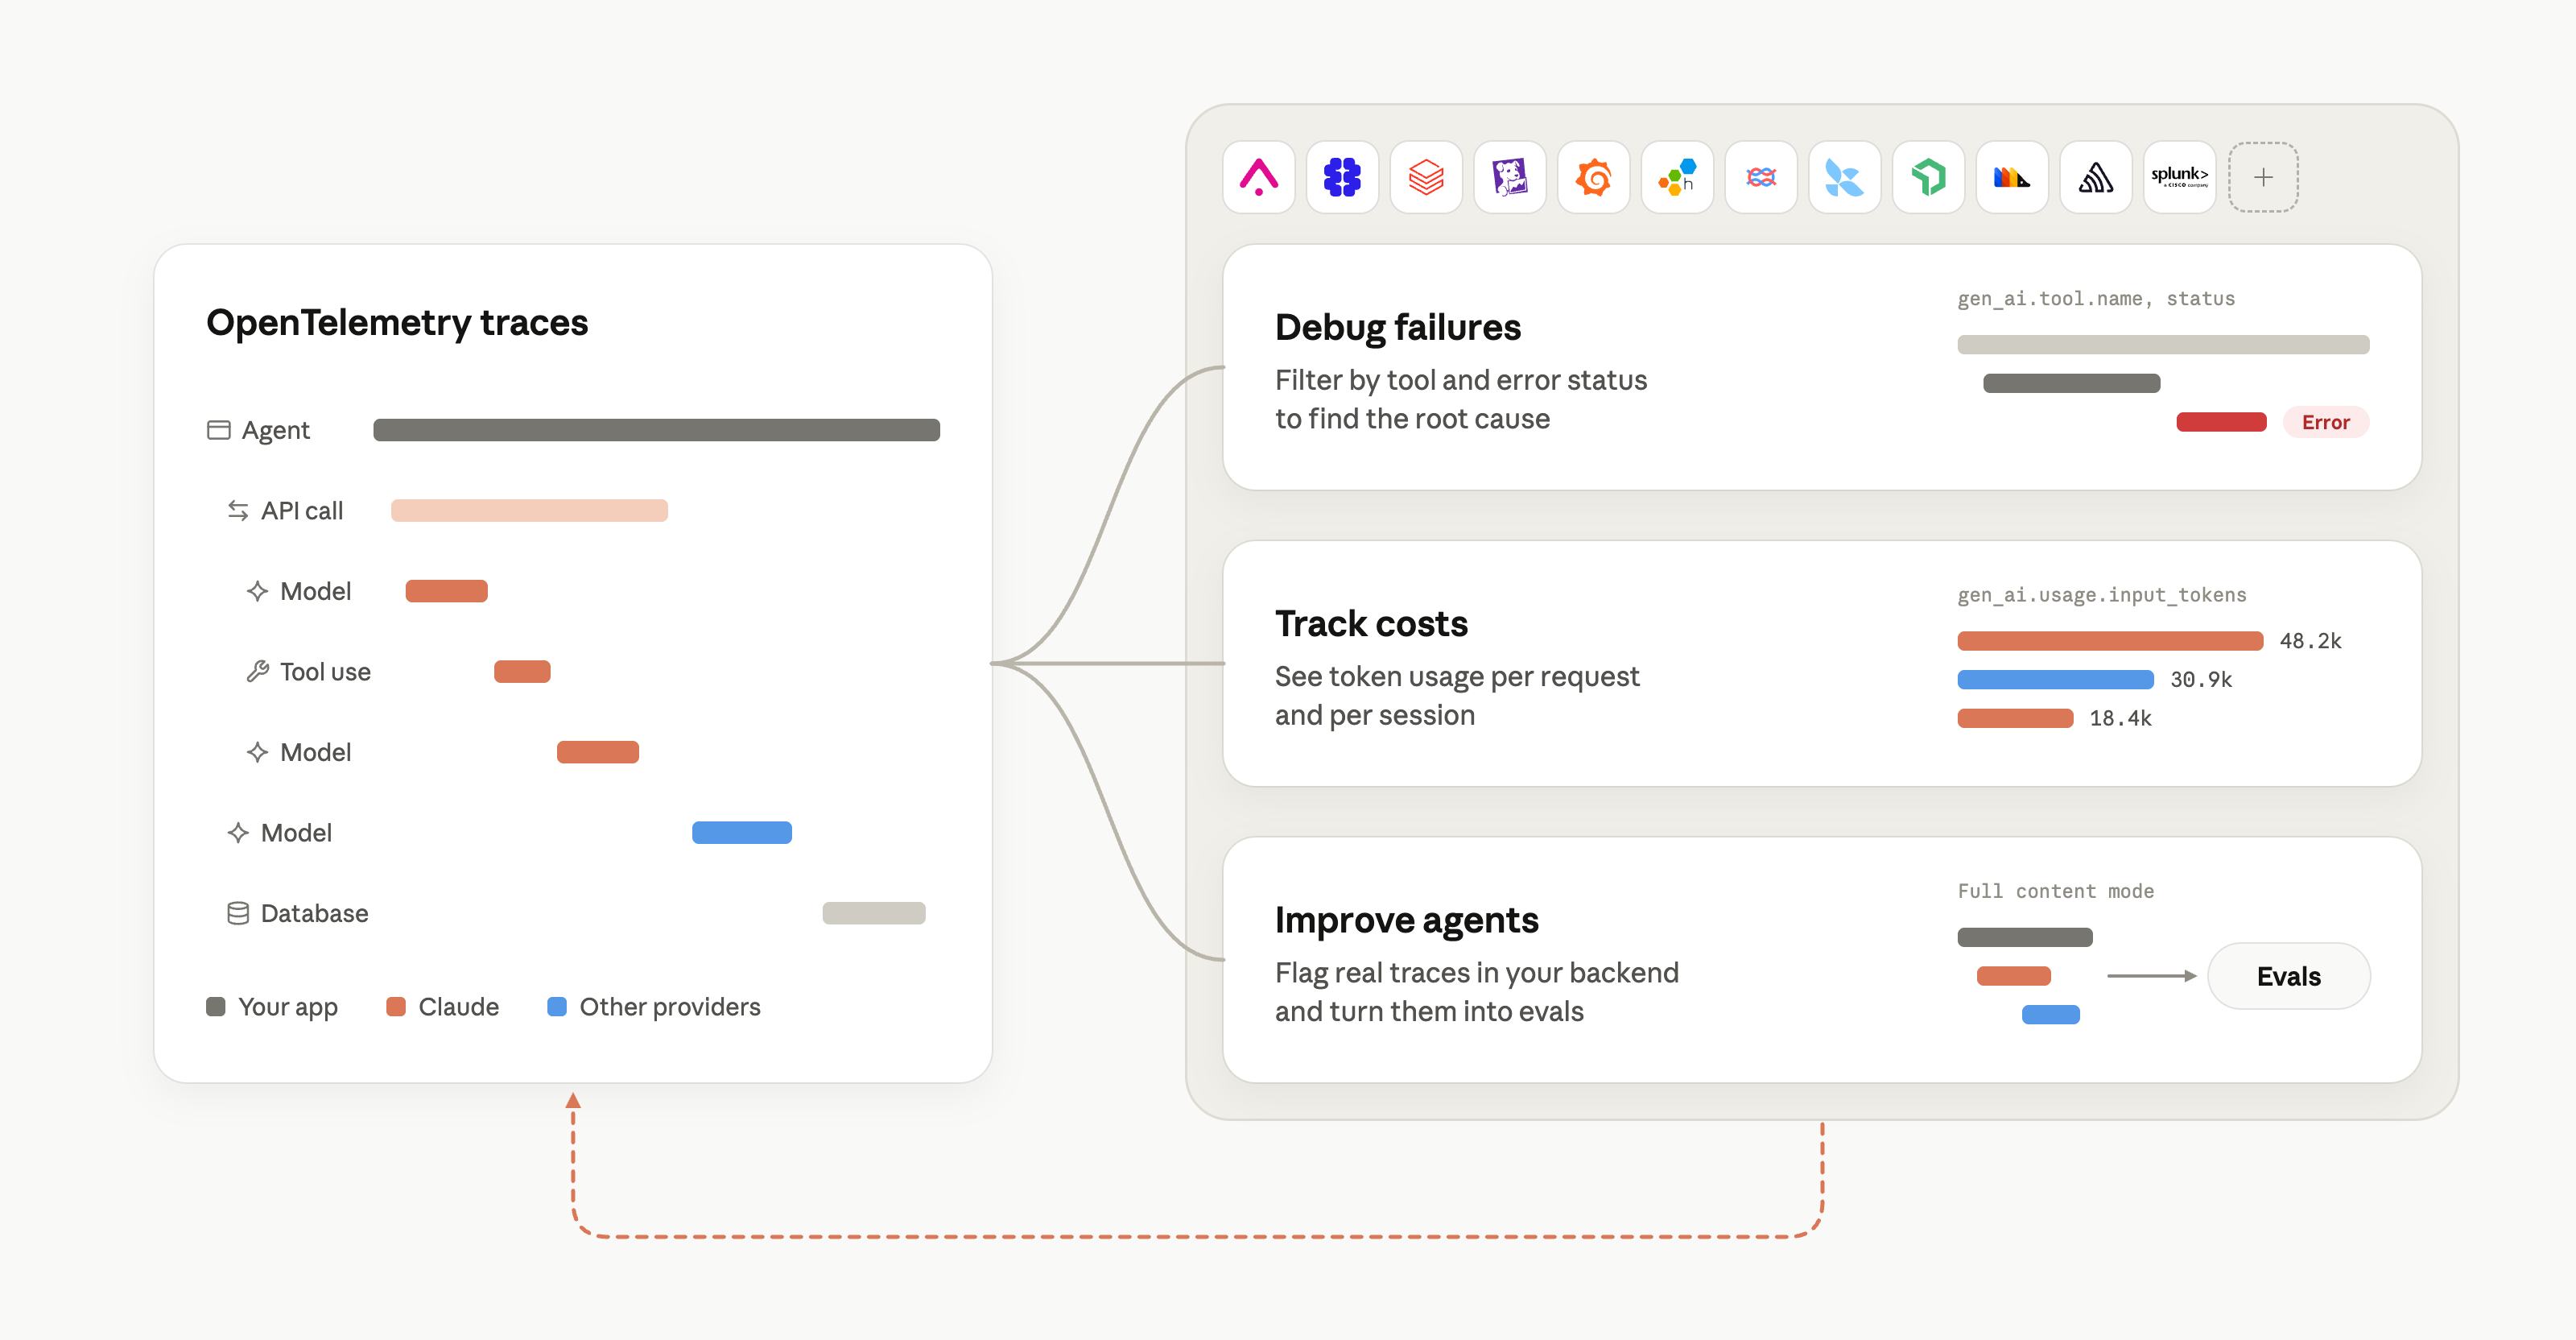
Claude 追踪遵循 OpenTelemetry GenAI 语义约定,因此 Claude 与其他提供商的数据可以在相同的工具和仪表板中协同使用。
- 在其余技术栈旁调试 Agent。在 Grafana Cloud、Honeycomb、Sentry 和 Splunk 中,Agent 追踪数据会与日志和指标并列展示,因此你可以了解某个缓慢或失败的步骤来自哪项服务。
- 利用生产数据改进 Agent。借助 Arize AI、Braintrust、Datadog、Langfuse、LangSmith by LangChain、New Relic 和 PostHog,你可以将真实追踪数据转化为评估(evals)、发现质量问题,并衡量某项改动是否带来了改善。
- 追踪全组织范围内的使用情况。将追踪数据发送至 Databricks Unity Gateway,以便平台与安全团队按团队查看 Token 使用情况,并标记异常活动。
Claude 追踪也可与任何接受标准 OTLP 端点的其他 OpenTelemetry 工具配合使用。
开始使用
Claude Platform 上的 OpenTelemetry 追踪目前处于公开测试阶段。Managed Agents 和 Messages API 需要在 Claude Console 中配置目标端,而 Claude SDKs 会自动导出追踪数据。
请参阅文档开始使用。
English / 原文
You can now send OpenTelemetry (OTel) traces from Claude Managed Agents, the Messages API, and Claude SDKs to any OTel tool, and follow each step your agents take. If you already send Claude Code or Cowork traces to your observability tool, the agents you build on the Claude Platform can also show up in the same place.
Trace agents with OpenTelemetry
Trusting an agent with more access starts with tracing its model calls, tool use, and MCP server calls. Review its traces, then widen its access as it proves reliable.
Add a destination in the Claude Console, and every agent turn, model call, and tool use arrives in your observability tool as a standard OpenTelemetry trace, with latency, tokens, and IDs.
Claude traces follow the OpenTelemetry GenAI semantic conventions, so data from Claude and other providers works in the same tools and dashboards.
- Debug agents next to the rest of your stack. In Grafana Cloud, Honeycomb, Sentry, and Splunk, agent traces sit beside your logs and metrics, so you can see which service a slow or failed step came from.
- Improve agents with production data. With Arize AI, Braintrust, Datadog, Langfuse, LangSmith by LangChain, New Relic, and PostHog, you can turn real traces into evals, catch quality issues, and measure whether a change helped.
- Track usage across your organization. Send traces to Databricks Unity Gateway so platform and security teams can see token usage by team and flag unusual activity.
Claude traces also work with any other OpenTelemetry tool that accepts a standard OTLP endpoint.
Get started
OpenTelemetry traces on the Claude Platform is available in public beta. Managed Agents and the Messages API need a destination in the Claude Console, while Claude SDKs export traces automatically.
See the docs to get started.