Datasette 在 GitHub 上的代码频率图表
英文标题:datasette code-frequency chart on GitHub
作者出于好奇,想寻找编码智能体和 Opus 4.5 级模型对个人产出的影响的可视化证据。其 Datasette 开源项目在 GitHub 上的代码变更频率图表显示,新增与删除的代码量在 2026 年出现大幅飙升。活动高峰与 Opus 4.8、GPT-5.5、Fable 5 及 GPT-5.6 Sol 等模型的发布时间吻合,直观展示了先进模型对开发者生产力的潜在推动。
打开原文相关 10.8 · 机会 5
 102.9 KB
中文
2026年7月13日 - 链接博客
Datasette 在 GitHub 上的代码频率图表。出于好奇,我想看看能否找到一个有用的图示,来说明编码智能体和 Opus 4.5 级模型对我个人产出的影响。到目前为止,我找到的最佳例子就是这张我的 Datasette 开源项目在 GitHub 上的代码变更频率图表:
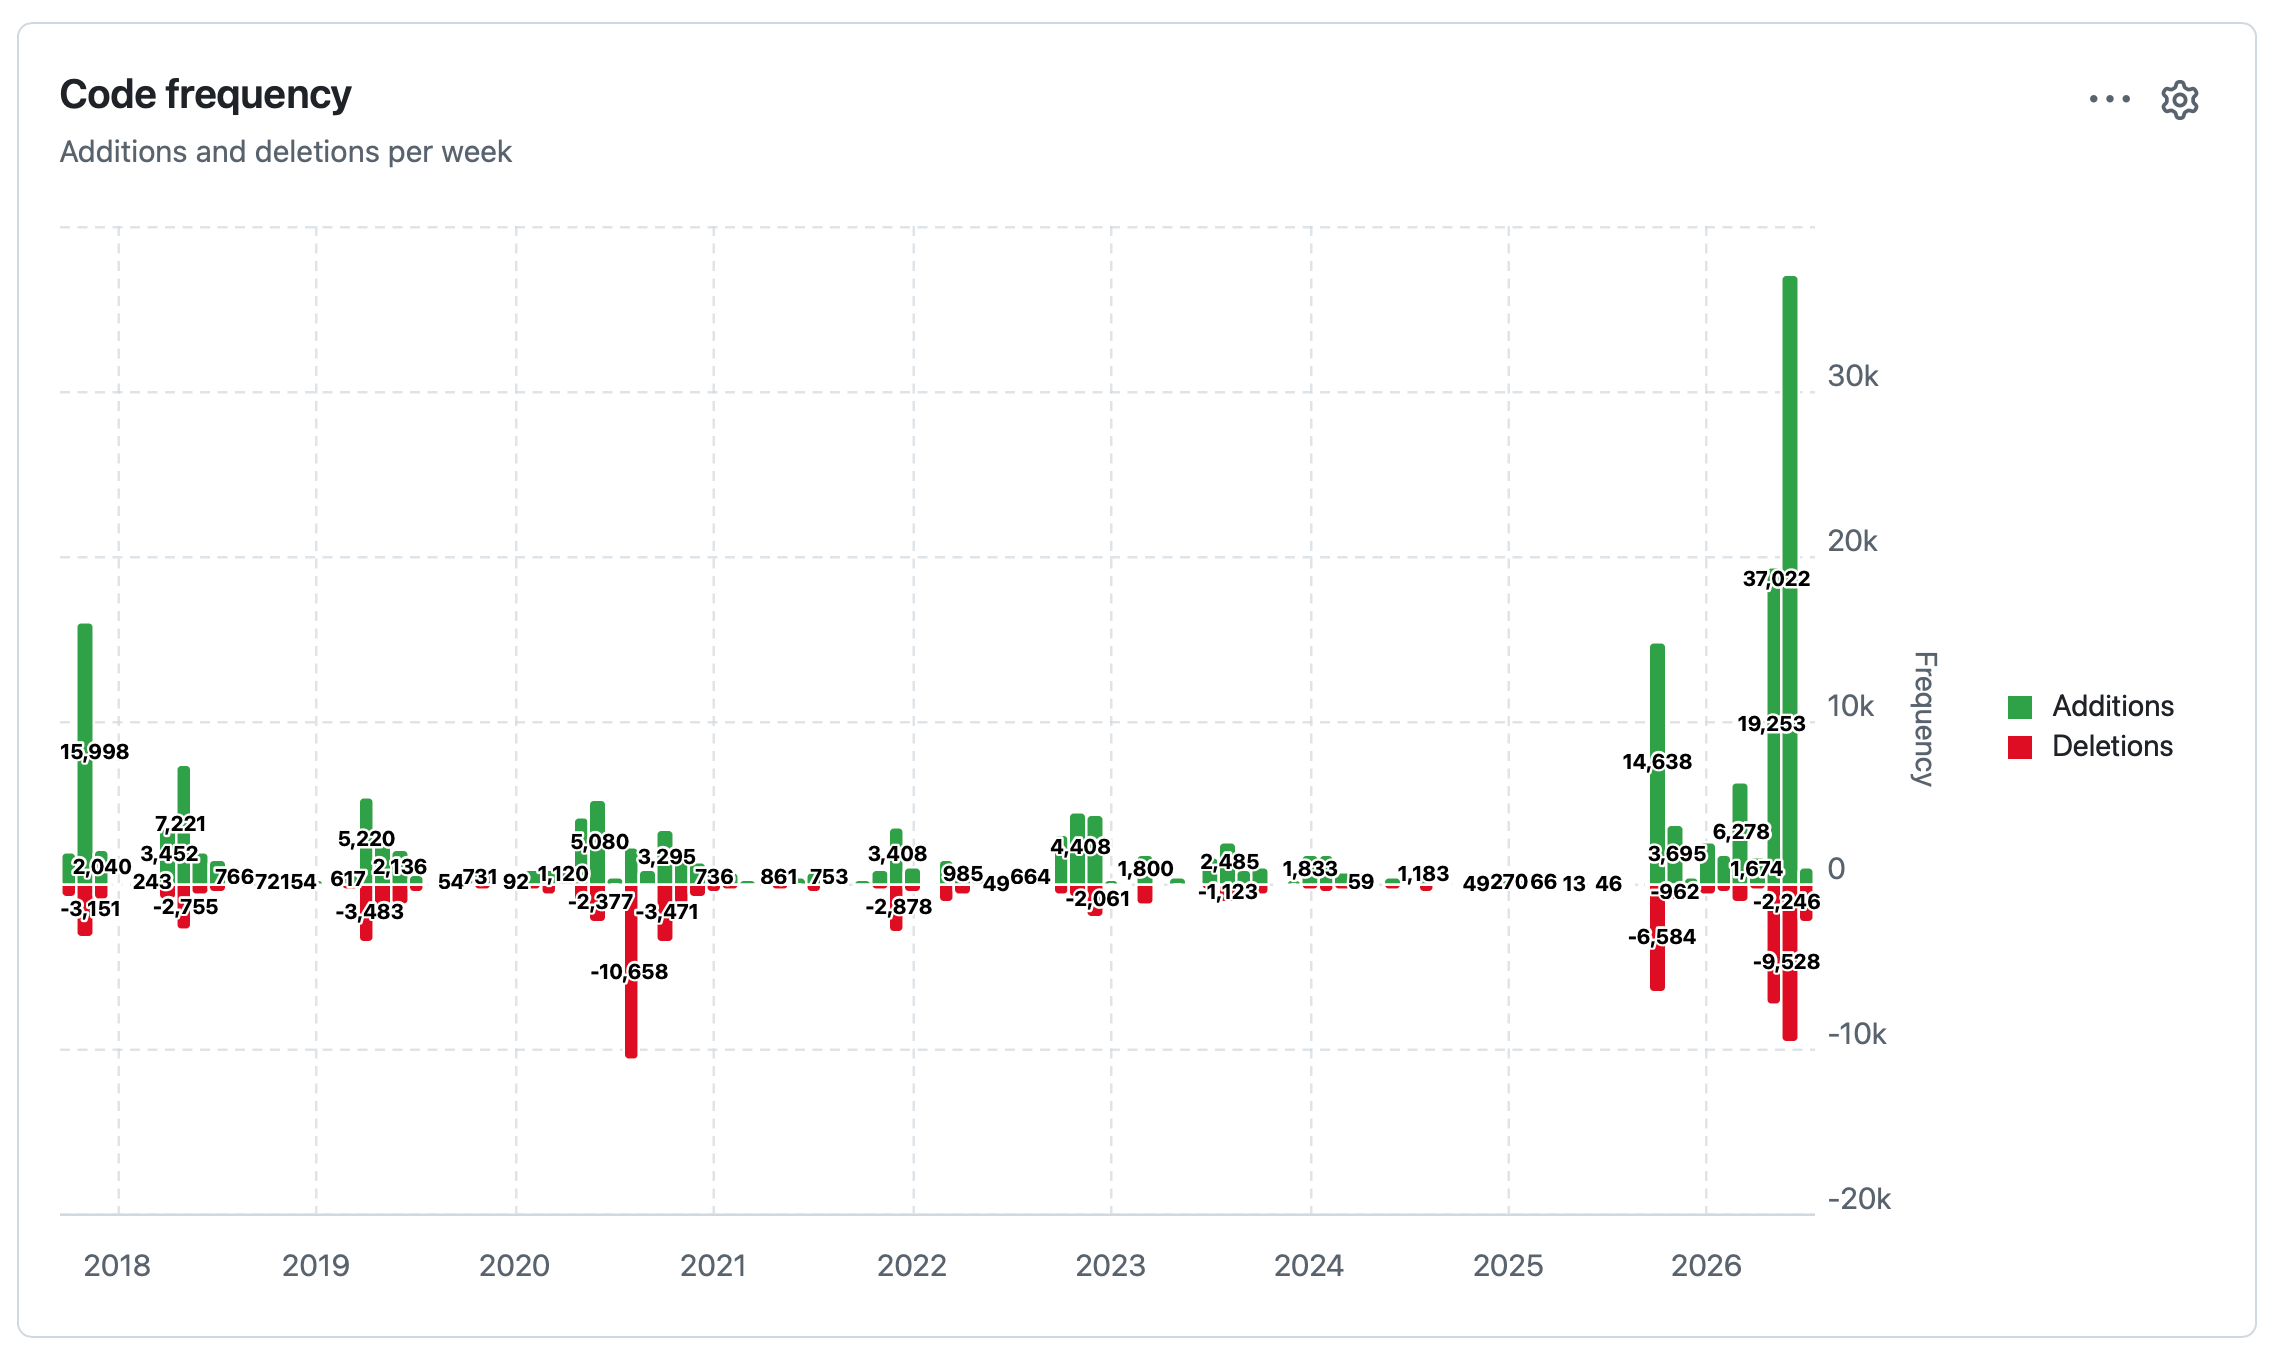
末尾的活动大幅飙升与 Opus 4.8、GPT-5.5、Fable 5 和 GPT-5.6 Sol 的出现时间相吻合。
English / 原文
13th July 2026 - Link Blog
datasette code-frequency chart on GitHub. Out of curiosity I decided to see if I could find a useful illustration of the impact of coding agents and Opus 4.5 class models on my own output. The best I've found so far is this GitHub chart of frequency of code changes to my Datasette open source project:
The big spike in activity at the end aligns with Opus 4.8, GPT-5.5, Fable 5 and GPT-5.6 Sol.